Area Estimation in Images Using Green’s Theorem
- Carl Naces

- Dec 16, 2018
- 2 min read
Creation of a synthethic image of a geometric shape was done.

The edges were detected using the known edge detection functions indicated below. The following process describe are seen in the attached code.
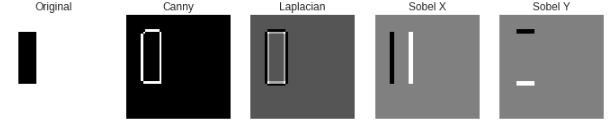
The edge pixel values were derived from the non-zero values in the image resulting from the canny edge detection method. The centroid was then subsequently computed as the mean of the coordinates of these edge pixels. The computed pixel coordinates are then converted into polar coordinates. These resulting polar coordinates are then sorted according to increasing theta and Green’s theorem can be finally implemented. A single function to compute the Green’s function of a given image was written and was used to four different shapes of three different resolutions.
Three rectangle, squares, triangle and cross images with resolutions/dpi of 50,150 and 300 were generated and the single function that was written in order to implement Green’s theorem and measure the shapes’ areas were used. Below are some examples of the generated shapes and how they look like when edge detection techniques are used on them.


The measurements for the generated shapes of different resolutions are shown in the table below. Pixels inside area area the total number of pixels that are inside the area for the shape. For example, in the cross image above, it is the number of black pixels in the image. Detected edges are the number of pixels considered as edges after edge detection. In the second above, this is represented by the pixels forming the white outline of your cross. Pixels inside the edges area the black pixels inside the detected edges. Finally, relative size is the ratio between the original area and the area detected after edge detection. Canny was the edge detection method used after comparing it visually with the other edge detection algorithm results.

Measuring Area in Google Maps
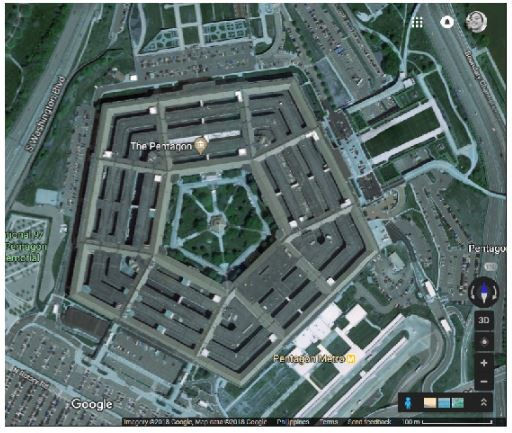
This is a picture of the pentagon building in google maps. Its known area is about 236 hec. The assumed edge of the building was cropped using imageJ and is shown below.

The histogram of this image was then plotted to see the distribution of the pixel values.

The pixel values were then replaced such that the area of the pentagon is represented by the white and all else is black.

The pixel area using Green’s theorem was then implemented. The pentagon Area from the pixels was 179205 and the area of the pixels of the area after edge detection was 265512. This suggests that there was an overestimation of the number of pixels. The total number of edges detected was 2361 and the relative size of this area after edge detection to the original area in pixels is 1.48. Since in the image roughly around 114.75 is equal to 100m we can compute the equivalent areas of using pentagonAreaReal = pentagonAreaGreen*((100/114.75)**2) and pentagonAreaReal2 = pentagonAreaPixels*((100/114.75)**2). The area or the original outlined pentagon is about 179205 square meters and the area calculated using green’s method is 136095 square kilometres.


Comments